Sustainability. It is not only a term but an entire idea, and possibly what can help save planet earth from its current devastation state. And so, sustainability science is an emerging research field that actively seeks to understand the fundamental link between human systems (including economic, social, and health dimensions, etc.), environmental systems (including ecosystem and natural resources, and biodiversity, etc.), and engineered or human-made systems.
By pursuing to bring about real-world solutions to complicated challenges endangering the survival of humankind and stability of life-support systems of the planet, it aims to promote a transition to sustainability. Typical examples of such challenges include climate change, loss of biodiversity, pollution, etc.
But how do we take such valuable research to more of humanity to care about the planet’s life-support systems?
For this purpose, a handful of science communication channels target professionals directly involved in implementing sustainability practices. Another innovative tactic offered by Arevalo et al. (2020) involves a visual storytelling approach to help the lay audience relate to the problem and applications better.
A picture is worth a thousand words.
As the name indicates, visual storytelling comprises the use of graphics, images, pictures, and videos to convey a message to the public. But what is the importance of visual storytelling for sustainability sciences?
Sustainability research through analysis and assessments helps formulate processes that link the knowledge obtained (science) and necessary actions (policy) per the obstacles. Such intricate information can leave the stakeholders such as cross-disciplinary practitioners, consultants, and government officials baffled, resulting in multiple interpretations by different actors involved.
Thanks to our brain, hardwired to respond quickly to images, we love and easily relate to a good visual story more than mere text material. Our brain processes content with visuals 60,000 times faster than those without. Out of the total information sent to our brain, 90% consist of only visuals. The brain also retains 80% of what one sees while only 20% of what is read.
Visual stories are noticeable, considered entertainment rather than monotonous scientific messages, and get shared more than textual stories. Having said that, visuals are thus an essential part of stories and not a replacement for texts.
Identify the intended audience and goals.
A typical earth sustainability project is multifaceted and can involve many actors or professionals from various fields like researchers, editorial teams, and storyline coordinators.
Typically, there are three types of audience—first, the science-informed audience, actively interested in scientific knowledge. Second, the science-interested audience willing to spare some time in learning the latest trends in science. Third, the audience who belong to either group, neither interested nor well-informed.
Before beginning the storytelling, one can identify and allocate the various stakeholders to various groups. Given this diverse population of the audience, eventually, the goals of telling a visual story are to:
- Ignite the interest of the audience.
- Share information with others.
Selecting the scientific content
The scientific content one selects for the communication needs to fit three criteria:
- Relevance: Degree to which content fits the audiences’ expectations & consider their decision-making needs
- Credibility: Audiences’ perception about the trustworthiness of the source and presentation of information
- Legitimacy: Extent of openness and observability of information for the audience
Moreover, one can also categorize the audience into slow (readers) and analytical thinkers or fast (readers) and intuitive thinkers. For example, a policymaker may not have hours to read the information and relies on quick and intuitive thinking.
In such a case, visuals help put across the required scientific content by providing shortcuts to translate the concepts coherently and rapidly.
Steps to prepare a compelling storyline
Identifying the story parts or elements of the narrative helps structure the storyline better. A scientific text can be distilled down to the main character, element or agent of the story, other actors, purpose or the desired goal for the main character, events happening, or acts performed per the main character, the setting, conflict, and the means helping or hindering problem-solving.
Further, one needs to decide whether the visual story needs to be author-driven or viewer-driven. Arevalo et al. (2020) built the visual story around river research to promote sustainable river management. They undertook the following five steps to create a sustainability science storyline effectively.

Step 1: Assemble the concept
Method: The concept of a storyline composed of more than one storyline, each focusing on one aspect and time scale of the issue.
Result: Narrowing down the audience from science-informed to interested stakeholders helps effective content selection and designing. Content should allow the audiences to connect with the application, rather than a mere visual summary of research results.
Step 2: Parts of the storyline
Method: Post having an ideal concept for the storyline, the different parts of research publications, such as the latest findings, methods, or prototype tools, were taken to develop the storyline. The problem at hand was the main character or the central element.
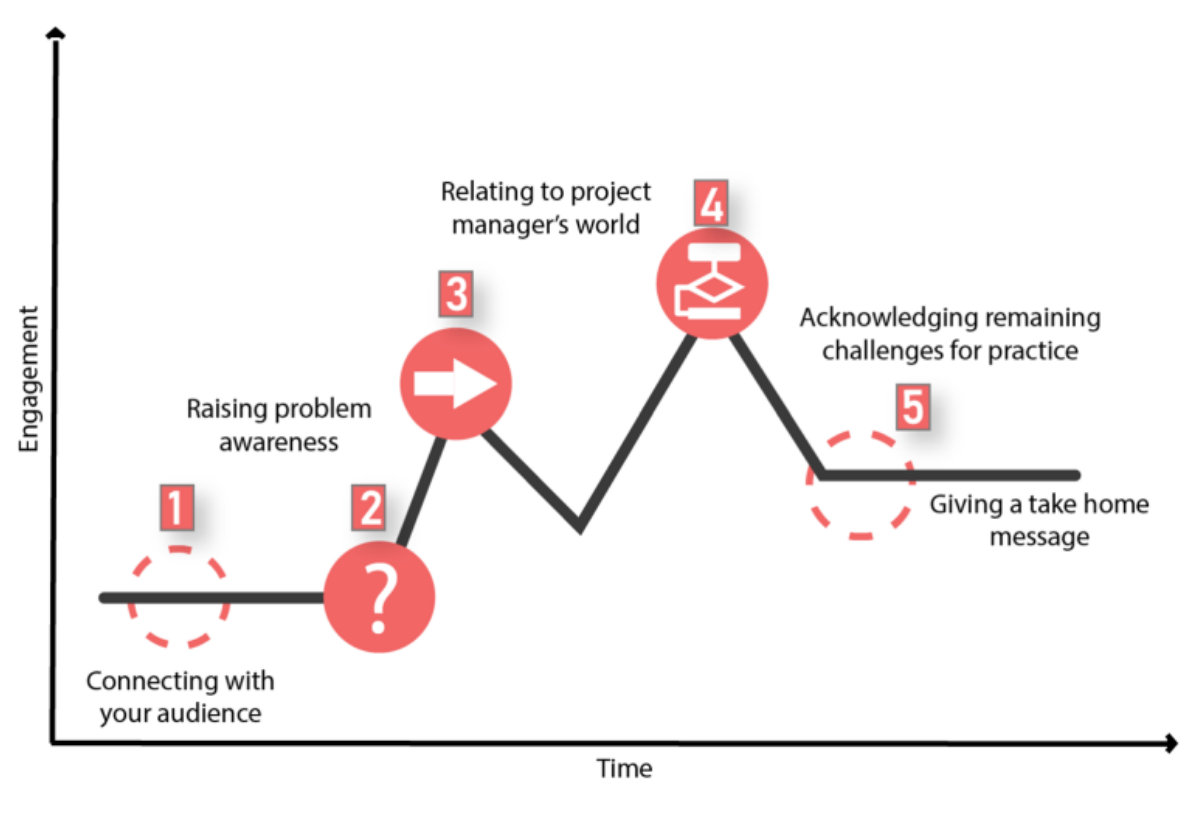
Result: Before telling the stories, you shall prioritize whether visuals complement the text or text complements the visuals. The visuals should not constitute an abstract representation of the location, or the actors. Instead, the visuals and text should follow an engaging sequence and flow the story to them. The sequence being:
- Connecting with audience
- Raising awareness
- Relating to the world of audiences’
- Acknowledging the remaining challenges
- Giving a take-home message
Step 3: Draft content (visuals and text)
Method: This is the most crucial step of all. The storyline’s content was narrated from the researcher’s perspectives and hence entailed participation from them. Following the storyline structure (as mentioned above), the text and visuals were filled.
Here, it was recommended to use active voice sentences to relate to the storyline. The storylines must end with a take-home-message and a call for action. This would inspire the audience to raise questions and seek further information.
Result: Several factors determine how one meets the audiences’ expectations.
Firstly, setting the title as a question only helps if the answer is woven into the content. Otherwise, it just leaves the audiences lost and ill-received. If the answer is not incorporated into the content, such as in ongoing research or a problem yet to be solved, it is better to establish the interest using the main discovery, finding, or take-home message.
Secondly, audiences want to see a central protagonist/main character. Thus, drafting the storyline from the perspective of the main protagonist is always important.
Thirdly, do not involve the audience in multiple details, methods, and applications. It is better to present the main messages, either how the findings improve work, affect various stakeholders, etc. Using visuals proves especially useful when the contributions are complicated per the complexity, abstraction, or scale. Visuals can also help relate the meaning of specific/scientific terms in a more relatable manner.
Step 4: Review the content
Method: Once the first draft of the storyline is finished, it must be disseminated among other project team stakeholders. It helps collate their suggestions and objection to help improve the storyline.
The use of interactive elements using special tools and software can help. We recommend exploring H5P for designing an interactive visual story.
Result: Using interactive elements is great but using intuitive features that help the user explore minimal time remains important to minimize distractions. Even if you are not using interactive elements, these should exemplify the main messages and avoid unnecessary details.
Also, if you are using visuals and text together, it will be better to use visuals that do not have any text. If the visuals have text elements such as a comic strip, you can do without text. Because it confuses and distracts the audience. Working with a multi-disciplinary team with complementary skillsets can help the researchers better disseminate their research that follows the design principles.
Step 5: Share and evaluate
Method: Next, the storyline must be shared with representatives of the concerned audience with a sample representing the organizations/stakeholders/public representatives involved in the project so that they may use the storyline for their purpose. This step aims to improve the content for the audience actively engaged in the exact cause.
Result: Inviting different perspectives for evaluating the storylines is beneficial as we often deem our ideas applicable based on our frames and perspectives. By inviting different sets of audiences, one can benefit from diverse and unbiased viewpoints.
In the end, the valuable research study helps us realize the importance of visual storytelling in sustainability sciences. It also teaches important aspects of creating a storyline and that one content does not fit all. Multi-disciplinary teams can help organizations and institutions achieve the desired goal.
If you are looking to prepare a visual story for your report, project, or research, reach out to us.